Showing posts with label Spanish. Show all posts

Tim Kaine speaking Spanish

Saturday, July 23, 2016

Since he was chosen for VP on the Democratic ticket today, and one of his qualities is being able to speak Spanish, the next question is going to be how well he speaks it. The answer: quite well. In this video he starts at 50 seconds.


And 1 minute in in this video.


Sometimes with someone who "speaks Spanish" you get that really heavy English accent accompanying it (think Bloomberg, very painful to listen to) but Kaine is a pleasure to listen to.

Personally my favourite candidate in this season's election is Bill Weld, but Kaine is up there as well.

Somebody commented that Kaine is probably going to forget how to speak English after this campaign since they'll be leveraging his Spanish as much as possible up to November, and it's probably true that we're going to hear a *lot* of him in Spanish over the next few months.

Read more...

50 minutes of Spanish with Portuguese subtitles

Friday, December 26, 2014

And by coincidence I found this on Christmas morning: a 50 minute interview in Spanish with Pope Francis that just happens to have Portuguese subtitles throughout as well. The subtitles really show that 1) the two languages are close enough that you could almost use one to write the other, but 2) you would still have to outright change about every tenth word.

Watching Spanish with Portuguese subtitles or the other way around (Catalan too) always feels like an alternate world where a less phonetic writing standard has been in use, something more akin to those used for English or French.


Read more...

What percentage of scientific publications are in Spanish?

Sunday, March 09, 2014

Instead of just revealing the number in the title, imagine what you think it is and then follow the link here to find the number. By the way, it's in fifth place and German is second after English. The article doesn't say which languages are in between but I will guess French, and...Japanese.


For posterity's sake (if the link dies in a year, for example) I'll include a paragraph from the article, and just white it out.

El volumen muestra datos contundentes. En la base de datos SCI, que indexa 8.300 revistas especializadas de 150 disciplinas científicas, el 97% de sus más de siete millones de artículos publicados entre 2005 y 2010 está en inglés. El alemán es el segundo idioma, con un porcentaje inferior al 1%. Y el español aparece como quinta lengua, con un ínfimo 0,24% de las publicaciones.

Read more...

How to think in Spanish

Sunday, December 01, 2013

I love these textbooks on Archive.org. One of them comes complete with movements to carry out while learning phrases.


Read more...

US census language map

Monday, September 02, 2013

Regarding a previous post on the distribution of languages spoken at home in the US (where Italian showed a marked decline), here is an interactive map showing which counties have more than 10% of the population using a language other than English. Most of these are Spanish, but we do see some other languages such as French in Louisiana, Portuguese in Massachusetts, and even Russian in Alaska. Navajo is also quite prevalent.

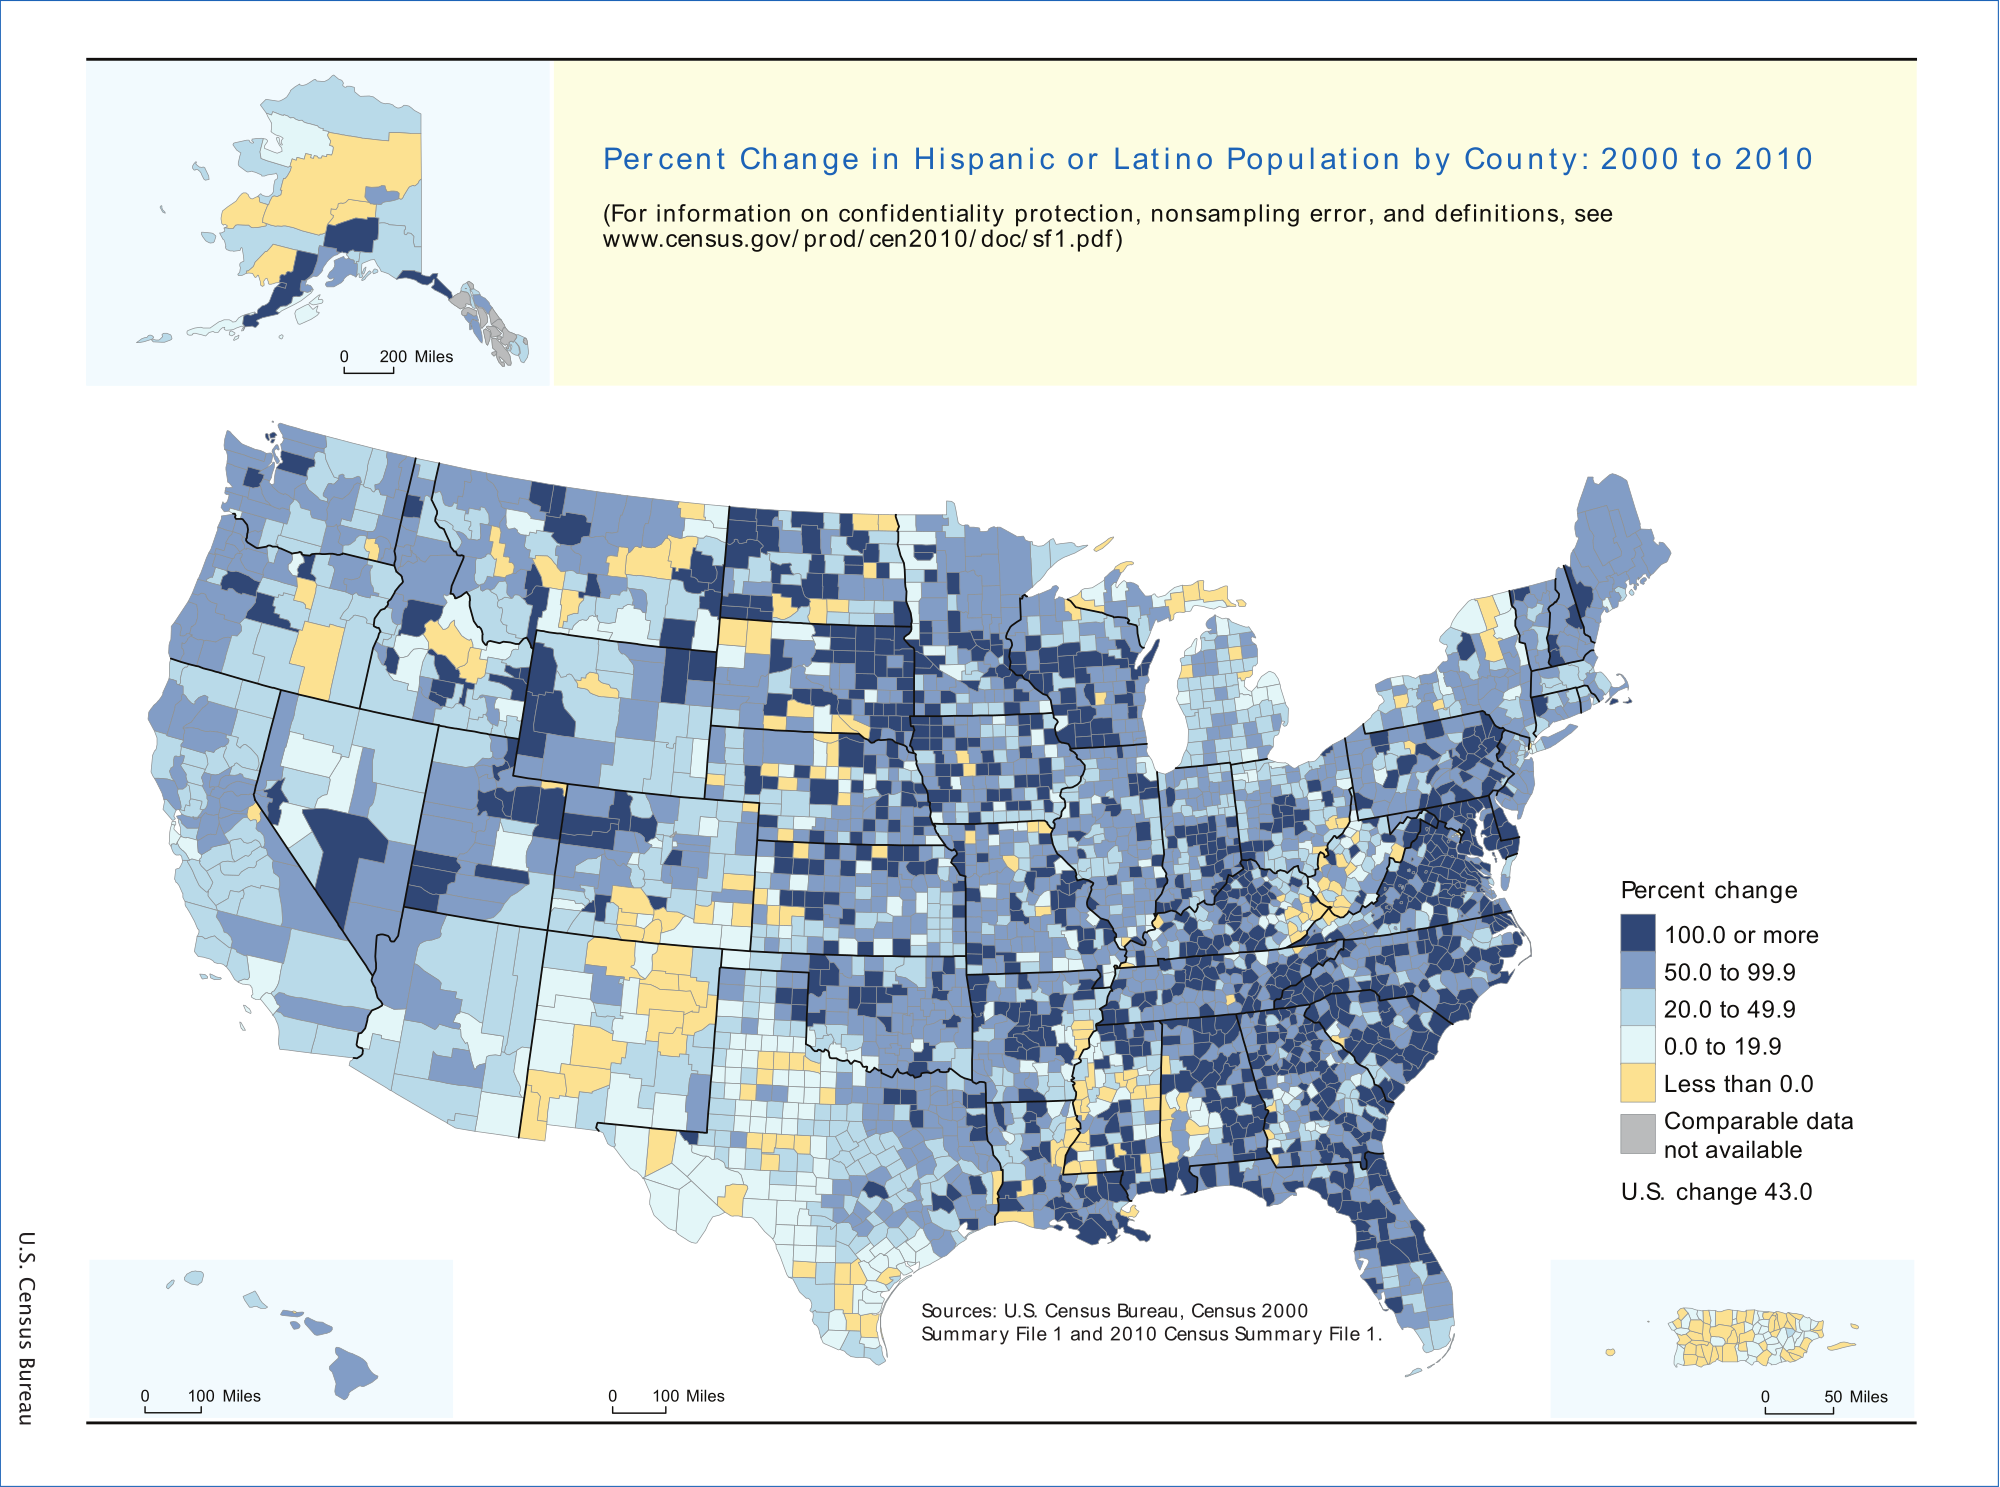
For the percent change in Latino population over ten years (2000 to 2010), Wikipedia has the following image. This of course does not necessarily reflect usage of the language itself (Latinos who do not speak Spanish are common), and dividing it up by county makes for quite the messy map. I prefer this table showing the percentage increase by state in the far right column.

Hispanic and Latino Population by state or territory (2000–2010)[10][11]
State/TerritoryPop 2000% pop 2000Pop 2010% pop 2010% growth
2000-2010
South Carolina South Carolina95,0762.4%235,6825.1%+147.9%
Alabama Alabama75,8301.7%185,6023.9%+144.8%
Tennessee Tennessee123,8382.2%290,0594.6%+134.2%
Kentucky Kentucky59,9391.5%132,8363.1%+121.6%
Arkansas Arkansas86,8663.2%186,0506.4%+114.2%
North Carolina North Carolina378,9634.7%800,1208.4%+111.1%
Maryland Maryland227,9164.3%470,6328.2%+106.5%
Mississippi Mississippi39,5691.4%81,4812.7%+105.9%
South Dakota South Dakota10,9031.4%22,1192.7%+102.9%
Delaware Delaware37,2774.8%73,2218.2%+96.4%
Georgia (U.S. state) Georgia435,2275.3%853,6898.8%+96.1%
Virginia Virginia329,5404.7%631,8257.9%+91.7%
Oklahoma Oklahoma179,3045.2%332,0078.9%+85.2%
Iowa Iowa82,4732.8%151,5445.0%+83.7%
Pennsylvania Pennsylvania394,0883.2%719,6605.7%+82.6%
Nevada Nevada393,97019.7%716,50126.5%+81.9%
Indiana Indiana214,5363.5%389,7076.0%+81.7%
West Virginia West Virginia12,2790.7%22,2681.2%+81.4%
Maine Maine9,3600.7%16,9351.3%+80.9%
Missouri Missouri118,5922.1%212,4703.5%+79.2%
New Hampshire New Hampshire20,4891.7%36,7042.8%+79.1%
Louisiana Louisiana107,7382.4%192,5604.2%+78.7%
Utah Utah201,5599.0%358,34013.0%+77.8%
Nebraska Nebraska94,4255.5%167,4059.2%+77.3%
Minnesota Minnesota143,3822.9%250,2584.7%+74.5%
Wisconsin Wisconsin192,9213.6%336,0565.9%+74.2%
Idaho Idaho101,6907.9%175,90111.2%+73.0%
North Dakota North Dakota7,7861.2%13,4672.0%+73.0%
Washington (state) Washington441,5097.5%755,79011.2%+71.2%
Vermont Vermont5,5040.9%9,2081.5%+67.3%
Oregon Oregon275,3148.0%450,06211.7%+63.5%
Ohio Ohio217,1231.9%354,6743.1%+63.4%
Kansas Kansas188,2527.0%300,04210.5%+59.4%
Wyoming Wyoming31,6696.4%50,2318.9%+58.6%
Montana Montana18,0812.0%28,5652.9%+58.0%
Florida Florida2,682,71516.8%4,223,80622.5%+57.4%
Alaska Alaska25,8524.1%39,2505.5%+51.8%
Connecticut Connecticut320,3239.4%479,08713.4%+49.6%
Massachusetts Massachusetts428,7296.8%627,6549.6%+46.4%
Arizona Arizona1,295,61725.3%1,895,14929.6%+46.3%
Rhode Island Rhode Island90,8208.7%130,65512.4%+43.9%
Texas Texas6,669,66632.0%9,460,92137.6%+41.8%
Colorado Colorado735,80117.1%1,038,68720.7%+41.2%
New Jersey New Jersey1,117,19113.3%1,555,14417.7%+39.2%
Hawaii Hawaii87,6997.2%120,8428.9%+37.8%
Michigan Michigan323,8773.3%436,3584.4%+34.7%
Illinois Illinois1,530,26212.3%2,027,57815.8%+32.5%
California California10,966,55632.4%14,013,71937.6%+27.8%
New Mexico New Mexico765,38642.1%953,40346.3%+24.6%
Washington, D.C. District of Columbia44,9537.9%54,7499.1%+21.8%
New York New York2,867,58315.1%3,416,92217.6%+19.2%
Puerto Rico Puerto Rico3,762,74698.8%3,688,45599.0%+0.2%
American Samoa American Samoa
Guam Guam
Northern Mariana Islands Northern Mariana Islands
United States Virgin Islands U.S. Virgin Islands15,19614.0%
United States United States of America35,305,81812.5%50,477,59416.3%+43.0%

Read more...

  © Blogger templates Newspaper by Ourblogtemplates.com 2008

Back to TOP