Showing posts with label geopolitics. Show all posts

The countries in Southeast Asia on the US's radar

Monday, February 22, 2016

This article on Obama's courting (for lack of a better word) countries in China's periphery is a short but good read, and lists the countries themselves:

Brunei, Cambodia, Indonesia, Laos, Malaysia, Myanmar (Burma), the Philippines, Singapore, Thailand, Vietnam.

Adding to that a few of the US's existing allies in the region (map made thanks to this site) and you can see how uncomfortably close this all is from China's point of view:


But then again everything there is uncomfortably close. Especially that strait where all the shipping passes through between Singapore, Malaysia, and Indonesia. And the whole South China Sea itself.

Read more...

Which is closer to Kaliningrad, Germany or Russia?

Friday, August 29, 2014

Kaliningrad AKA Königsberg is an exclave of Russia, used to be a part of the German Empire, both joined to the country,


as well as separated from it. So being a Russian exclave isn't its first time being an exclave.


But which country is it closer to? On a map it looks fairly close. What is the exact distance?

There are more precise tools out there, but the distance calculator for Google Maps placed on two points that seem to be closest to each other will give us a good idea. The rules are that we are going as the crow flies, and sea borders don't count.

Let's start with Germany. We head to the northeast, get as close to the sea as possible along the Polish border, and extend the second point to that sandbar-like protrusion that I don't remember the name of.


That works out to: 357.539 km.

And Russia? The closest point is down in that corner where Russia, Latvia and Belarus share a border. It's not exactly on that confluence of the three countries, but it's close. The closest point in Kaliningrad is a part that bumps out a bit on the northeast due to a small river marking the border, and happens to be the closest part.


And the distance? It's...

...

362.122 km. Germany by a nose.

Read more...

Caspian Sea over Western Europe, western Canada

Saturday, July 19, 2014

The Caspian is probably the biggest reason why some countries that are technically landlocked still aren't in the sense that they have a thriving maritime culture. Azerbaijan in particular, which has 800 km of coastline and a navy with 5000 personnel.


Feel free to superimpose the Caspian on another part of the world using this link:

http://mapfrappe.com/?show=20498

Read more...

Languages by state and province besides English, Spanish, and French

Tuesday, May 20, 2014

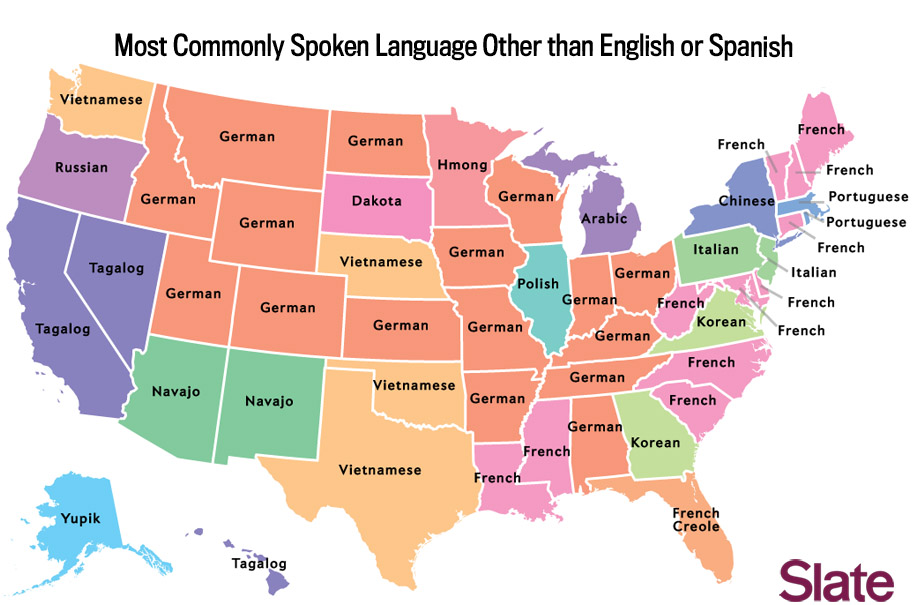
Two maps popped up last week that show the #3 (in most cases) language by state in the US, and by province in Canada. In other words, the language besides English and Spanish in the US and the language besides English and French in Canada. In most cases this is the third most spoken language, but not always.

The US one is here, and is done by Slate. The most common language on the map: German. On the other hand, it's the #3 language predominantly in states with a fairly low population. The state with German with the highest population is...I will guess Ohio, correct me if I'm wrong.

French is doing fairly well on the east coast and in Louisiana, of course. And in Florida we have almost French.

Inspired by this, a Reddit user created one for Canada.


Apparently in Alberta's case German almost made it, but was about 10,000 short of Chinese.

Read more...

We need a few hundred Voronoi diagrams

Monday, April 07, 2014

Remember this post from 2011? I do. It's about an interesting thread on HTLAL where a user named nway, one of our friends here as well, did some interesting statistical analysis on the present and future value of languages.

Also do you remember this post from 2009? I do. It's an article about Mpumalanga in South Africa, which is next to Mozambique and where Portuguese is naturally a more important language to know than in most other parts of South Africa. Taking a look at countries and states at a local level, especially their nearest neighbors, is very important in determining the future of language education in any country.

And now to Voronoi diagrams. These show the nearest something to somewhere. For example, the country that is nearest to you when you are in...Frankfurt, or somewhere else. These maps have been very popular on /r/mapporn recently. For example, this one of Germany.


It shows that if you are in Frankfurt for example, France is the nearest place to you. If you are in München, it's Austria. Berlin, it's Poland.

Here's another one with Canada.

France is there because of Saint Pierre and Miquelon.


If I had a team of ten or so people at my beck and call, I would design the following map:

First I would generate a world map similar to those maps that show countries by GDP size, but less ugly, and have it done by region as well since regions often have separate languages. Languages with certain international prestige, such as frequently being the official language of important groups (UN, NATO, EU, international airports, etc.) may be amplified even further beyond their GDP.

Then I would colour-code these regions by language.

Then I would make them all into a Voronoi diagrams, showing which language, and its GDP, is closest to you based on where you stand.

And because there's no way I would attempt something like this on my own, I hope somebody reads this and decides to take the time to do just that.

Read more...

Galp Energia CEO believes oil will improve geopolitical position of Portuguese

Monday, March 24, 2014

Publico has an interview with the CEO of Galp Energia, a Portuguese energy firm with about 7000 employees, who believes upcoming production of oil in Brazil and gas in Mozambique are a good sign for the geopolitical importance of the Portuguese language.

Taking a look at the firm's worldwide presence shows a large similarity to the Portuguese Empire. Where the company operates:


and the Portuguese Empire:


Much of the article is about the company itself and its partner Sinopec. Taking that out and condensing some of the more general parts the executive summary is:

The CEO of Galp Energia, Ferreira de Oliveira, believes that Brazilian oil and gas from Mozambique will change the perception the world has of the CPLP (Community of Portuguese Language Countries). Galp expects to produce 300,000 barrels of oil per day in 2020, 80% from Brazil. In the past year the company invested $600 million in oil exploration there. Most of the production is to take place in the Lula and Iara fields, and production will begin in 2017.

Q: Will Brazil continue to be the main priority for Galp Energia, or will it move to Angola, or more likely, to Mozambique?

A: "In the Lusophone countries, especially in Angola, Mozambique and Brazil, from 2006 to today, we have seen 26% of all new discoveries of oil and gas. If we count only deepwater discoveries, they make up 52%. The rate of growth here will be explosive. I have no doubt that this decade in which we are living will position the CPLP geopolitically in the world. Mozambique is now developing the largest gas project in the world, and Brazil the largest oil project in the world. Being in these two projects is an enormous privilege and a huge responsibility.

Read more...

International aid given by Canada

Monday, March 17, 2014

This map is a lot of fun, showing Canada's aid to each and every country it has given money to from 2001 to 2012.

For 2012 the largest recipients were:

The largest recipient was Ethiopia (CAD$ 207 million), followed by Haiti, Tanzania, Afghanistan, Ghana, Sudan and South Sudan, Mozambique and Pakistan.
What's extra fun about the map though is the ability to select a rectangular region, after which the overall trend over time can be seen. Ukraine for example has gone up from $22 million in 2010 to $48 million in 2012, while Moldova is about the same. Afghanistan has dropped from $345 million in 2008 to $163 million in 2012. Canada as of last week is now officially finished in Afghanistan, so this should continue to decrease. Croatia has gone from $2.7 million in 2005 to just $42,000 in 2012, which makes sense because it was a year away from full EU membership. Bulgaria has received more or less nothing since its accession as well, going from $2.8 million in 2003 to never over $100,000 in any year since 2009.

And so on. There's lots to be seen in this map.

Read more...

Most used languages on Twitter (late 2013 edition)

Monday, December 30, 2013

A link I've been meaning to mention for about a month now - according to a new study Portuguese is in fifth place in terms of tweets. This one seems to have combined languages that should be combined, showing Malay (plus Indonesian I assume) in 4th place.

The rankings are:

English - 36%
Japanese - 16%
Spanish - 12%
Malay - 8%
Portuguese - 6%
Arabic - 6%
French - 2%
Turkish - 2%
Thai - 1%
Korean - 1%


French at 2% seems rather low though. This link places it at just under 4%, which feels more right to me. Hopefully the study in the first link did not simply assume all tweets from certain countries were sent in that language.

Read more...

US census language map

Monday, September 02, 2013

Regarding a previous post on the distribution of languages spoken at home in the US (where Italian showed a marked decline), here is an interactive map showing which counties have more than 10% of the population using a language other than English. Most of these are Spanish, but we do see some other languages such as French in Louisiana, Portuguese in Massachusetts, and even Russian in Alaska. Navajo is also quite prevalent.

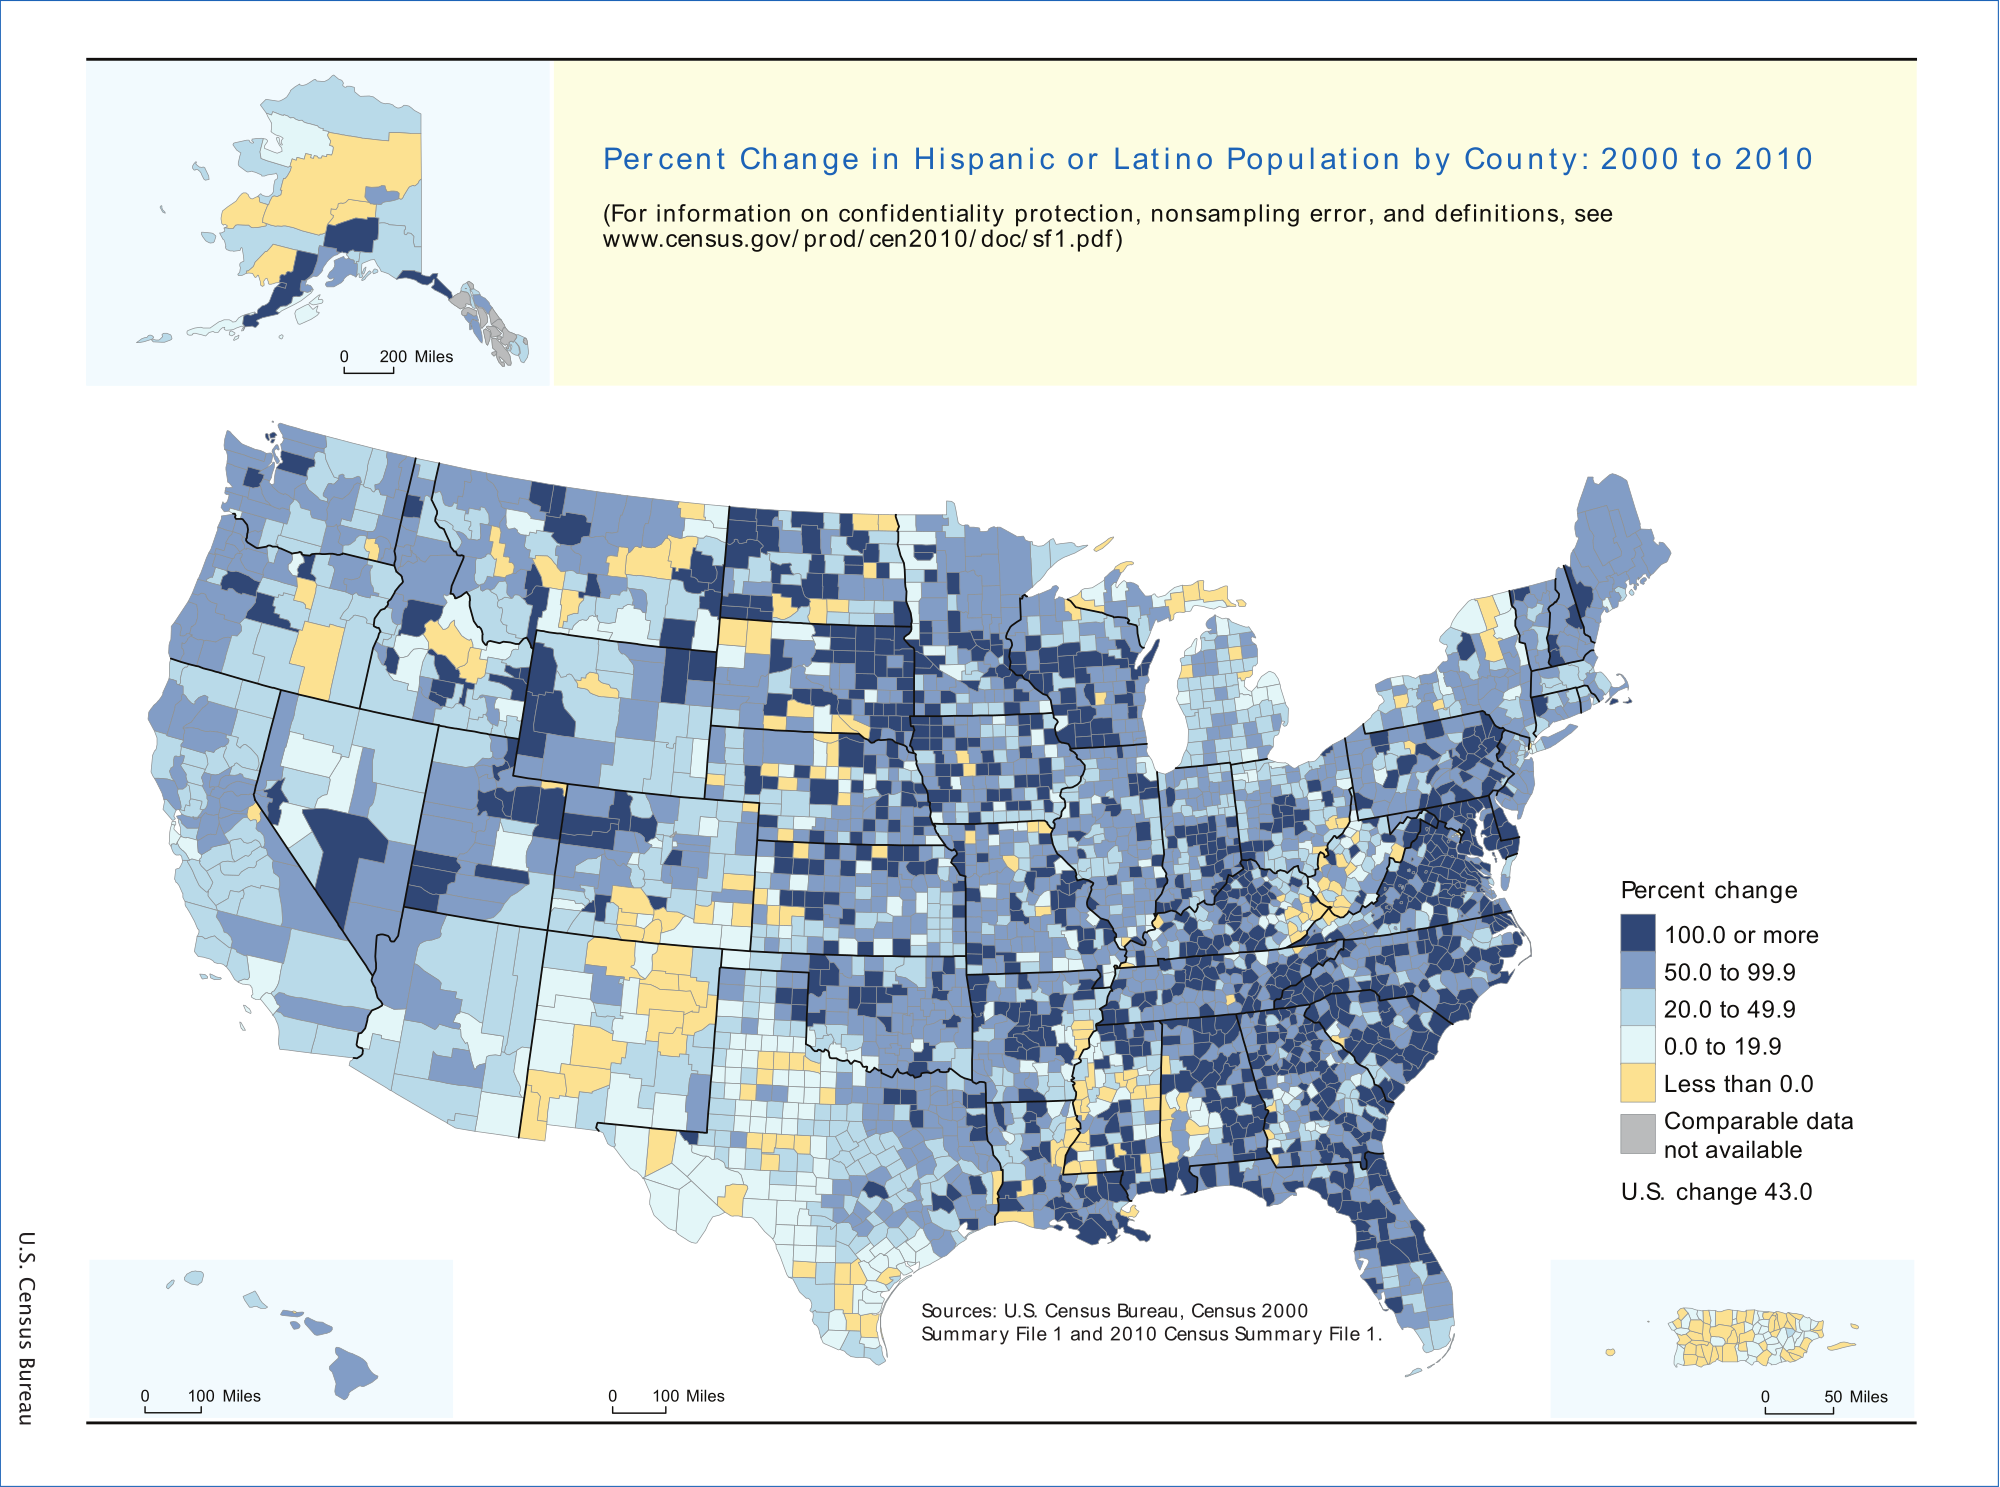
For the percent change in Latino population over ten years (2000 to 2010), Wikipedia has the following image. This of course does not necessarily reflect usage of the language itself (Latinos who do not speak Spanish are common), and dividing it up by county makes for quite the messy map. I prefer this table showing the percentage increase by state in the far right column.

Hispanic and Latino Population by state or territory (2000–2010)[10][11]
State/TerritoryPop 2000% pop 2000Pop 2010% pop 2010% growth
2000-2010
South Carolina South Carolina95,0762.4%235,6825.1%+147.9%
Alabama Alabama75,8301.7%185,6023.9%+144.8%
Tennessee Tennessee123,8382.2%290,0594.6%+134.2%
Kentucky Kentucky59,9391.5%132,8363.1%+121.6%
Arkansas Arkansas86,8663.2%186,0506.4%+114.2%
North Carolina North Carolina378,9634.7%800,1208.4%+111.1%
Maryland Maryland227,9164.3%470,6328.2%+106.5%
Mississippi Mississippi39,5691.4%81,4812.7%+105.9%
South Dakota South Dakota10,9031.4%22,1192.7%+102.9%
Delaware Delaware37,2774.8%73,2218.2%+96.4%
Georgia (U.S. state) Georgia435,2275.3%853,6898.8%+96.1%
Virginia Virginia329,5404.7%631,8257.9%+91.7%
Oklahoma Oklahoma179,3045.2%332,0078.9%+85.2%
Iowa Iowa82,4732.8%151,5445.0%+83.7%
Pennsylvania Pennsylvania394,0883.2%719,6605.7%+82.6%
Nevada Nevada393,97019.7%716,50126.5%+81.9%
Indiana Indiana214,5363.5%389,7076.0%+81.7%
West Virginia West Virginia12,2790.7%22,2681.2%+81.4%
Maine Maine9,3600.7%16,9351.3%+80.9%
Missouri Missouri118,5922.1%212,4703.5%+79.2%
New Hampshire New Hampshire20,4891.7%36,7042.8%+79.1%
Louisiana Louisiana107,7382.4%192,5604.2%+78.7%
Utah Utah201,5599.0%358,34013.0%+77.8%
Nebraska Nebraska94,4255.5%167,4059.2%+77.3%
Minnesota Minnesota143,3822.9%250,2584.7%+74.5%
Wisconsin Wisconsin192,9213.6%336,0565.9%+74.2%
Idaho Idaho101,6907.9%175,90111.2%+73.0%
North Dakota North Dakota7,7861.2%13,4672.0%+73.0%
Washington (state) Washington441,5097.5%755,79011.2%+71.2%
Vermont Vermont5,5040.9%9,2081.5%+67.3%
Oregon Oregon275,3148.0%450,06211.7%+63.5%
Ohio Ohio217,1231.9%354,6743.1%+63.4%
Kansas Kansas188,2527.0%300,04210.5%+59.4%
Wyoming Wyoming31,6696.4%50,2318.9%+58.6%
Montana Montana18,0812.0%28,5652.9%+58.0%
Florida Florida2,682,71516.8%4,223,80622.5%+57.4%
Alaska Alaska25,8524.1%39,2505.5%+51.8%
Connecticut Connecticut320,3239.4%479,08713.4%+49.6%
Massachusetts Massachusetts428,7296.8%627,6549.6%+46.4%
Arizona Arizona1,295,61725.3%1,895,14929.6%+46.3%
Rhode Island Rhode Island90,8208.7%130,65512.4%+43.9%
Texas Texas6,669,66632.0%9,460,92137.6%+41.8%
Colorado Colorado735,80117.1%1,038,68720.7%+41.2%
New Jersey New Jersey1,117,19113.3%1,555,14417.7%+39.2%
Hawaii Hawaii87,6997.2%120,8428.9%+37.8%
Michigan Michigan323,8773.3%436,3584.4%+34.7%
Illinois Illinois1,530,26212.3%2,027,57815.8%+32.5%
California California10,966,55632.4%14,013,71937.6%+27.8%
New Mexico New Mexico765,38642.1%953,40346.3%+24.6%
Washington, D.C. District of Columbia44,9537.9%54,7499.1%+21.8%
New York New York2,867,58315.1%3,416,92217.6%+19.2%
Puerto Rico Puerto Rico3,762,74698.8%3,688,45599.0%+0.2%
American Samoa American Samoa
Guam Guam
Northern Mariana Islands Northern Mariana Islands
United States Virgin Islands U.S. Virgin Islands15,19614.0%
United States United States of America35,305,81812.5%50,477,59416.3%+43.0%

Read more...

  © Blogger templates Newspaper by Ourblogtemplates.com 2008

Back to TOP